Foreign outflows and broad declines due to geopolitical risk-off sentiment sends PSEi down -2.13% (Mar 05, 2026)
PSEi closed lower at 6,307.84, falling 2.13% as net foreign selling hit P1.40B. The Mining And Oil sector led decliners, while PCOR posted significant gains.

Market Snapshot
Market & Dividend Calendar

Sources: Investing.com, PSE Edge
Foreign outflows and broad declines send PSEi plunging 2.13% to one-month low.
PSEi sheds -2.13% to close at 6,307.84. Market breadth was overwhelmingly negative as 179 decliners outpaced 35 gainers, while the Services sector, though down 0.56% showed relative strength versus other sectors amid broad net foreign selling amounting to P1.40 billion.
The Philippine peso also faced headwinds, closing at 58.51 against the US dollar.
Index and Sectors
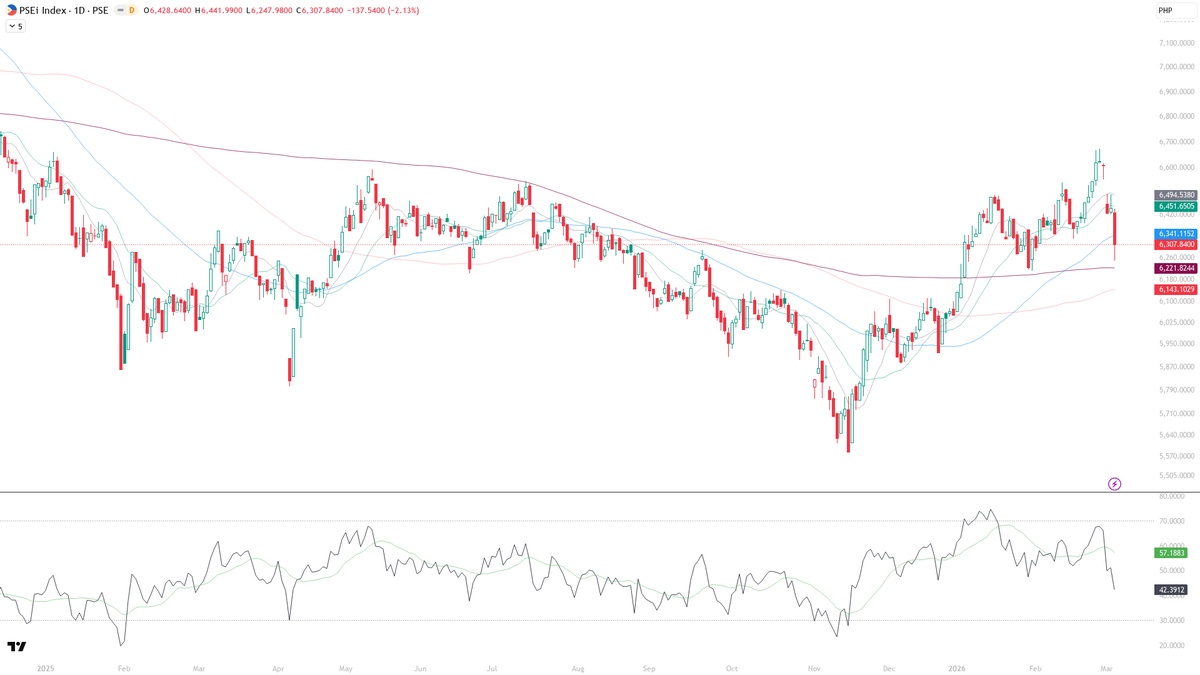
PSEi 1-Year Chart
The PSEi is in a short-term downtrend, with price (6,307.84) trading below its 10d (6,494.5) and 20d (6,451.6) SMAs, where the 10d has crossed below the 20d. The medium-term trend has also weakened as price dropped below the 50d SMA (6,341.1), with the 20d crossing below the 50d. RSI is at 42.3912, below 50 and its 20-day MA (57.1883), with both lines exhibiting clear downward slopes.
PSE Heatmap
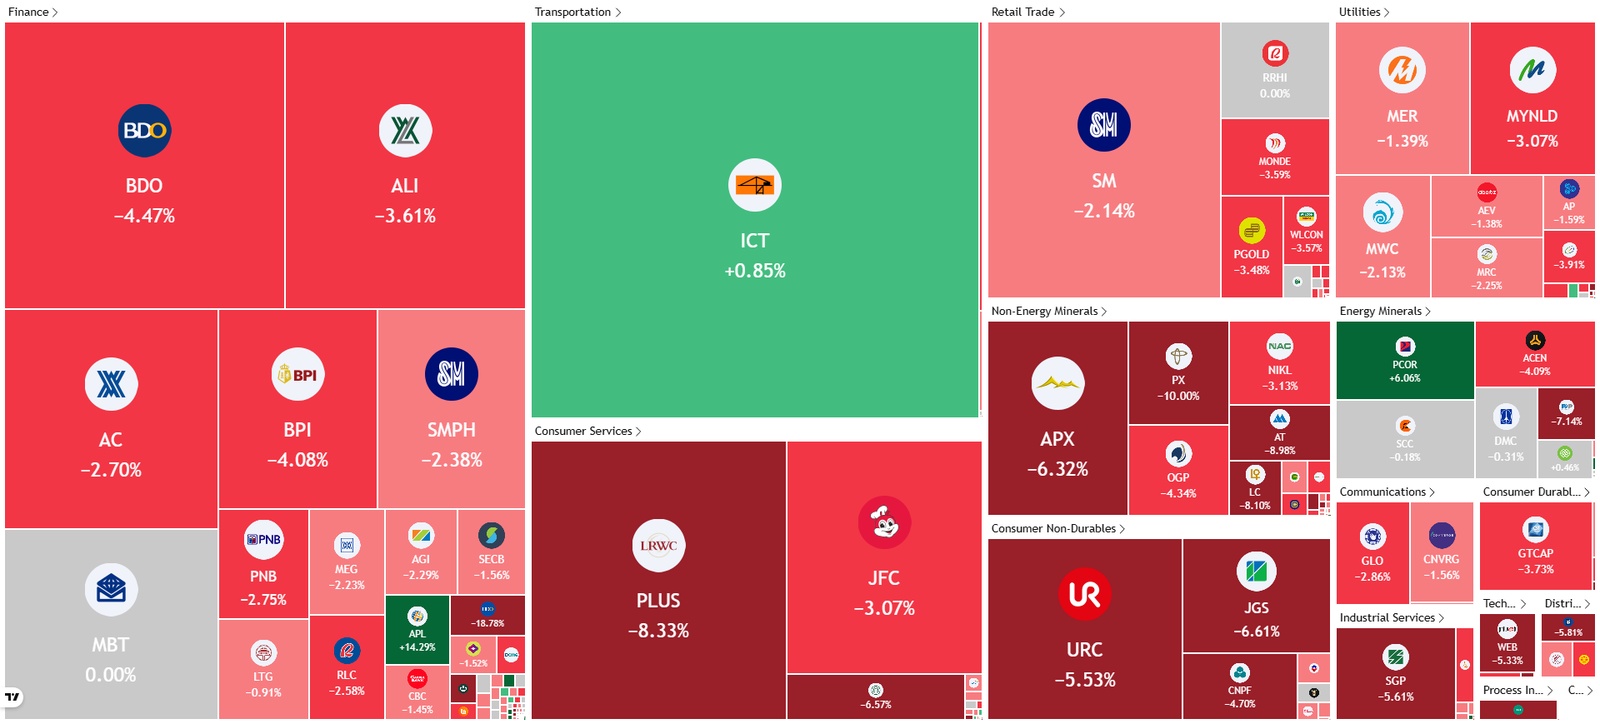
Declining issues significantly outnumbered advancers by 179 to 35, signaling widespread market weakness. Key large-cap movements included BDO declining -4.47%, while ICT posted a gain of +0.85% and PX saw a substantial drop of -10.00%. The market exhibited an overwhelming concentration of negative performance, with Finance and Mining And Oil sectors registering significant overall declines.
Daily Movers


Highly Viewed Disclosures
Global Markets & Macro
Global Equities Diverge: Europe Surges, US Climbs as Asian Markets Plunge
Global equities saw sharp divergence, with Europe and the US rallying while Asian markets plunged. Germany's DAX led gains, surging 1.74%, as the Nasdaq 100 climbed 1.51% and the S&P500 added 0.78%. However, Thailand plummeted 5.58%, the Nikkei dropped 3.61%, and the Hang Seng retreated 2.01%. This Asian sell-off was likely driven by Mideast oil crisis fears and signals for an extended Fed rate pause. The VIX fell 10.27% to 21.15, reflecting subdued volatility.
Crude Oil Surges on Mideast Crisis; Industrial Metals Rally Sharply
WTI crude surged 1.97% to US$76.03/bbl, propelled by escalating Mideast oil crisis concerns that revive global stagflation fears. Aluminum rallied sharply by 4.24% to US$3,300.00/mt, while copper advanced 2.27% to US$5.90/lb, both indicating robust industrial demand. Natural gas, however, slipped 3.77% to US$2.94/MMBtu, despite geopolitical supply warnings.
Gold Surges Above $5,150 as Crisis Warning Fuels Safe-Haven Demand
Gold surged 1.02% to US$5,159.40/oz, extending gains as safe-haven demand intensified following a Goldman strategist's warning of pre-2008 financial crisis signs for stocks. This triggered a flight to safety among investors. Silver tracked gold's momentum, climbing 1.07% to US$83.81/oz, also benefiting from the increased risk aversion in broader markets.
Global Indices & Commodities
Stocks in Focus
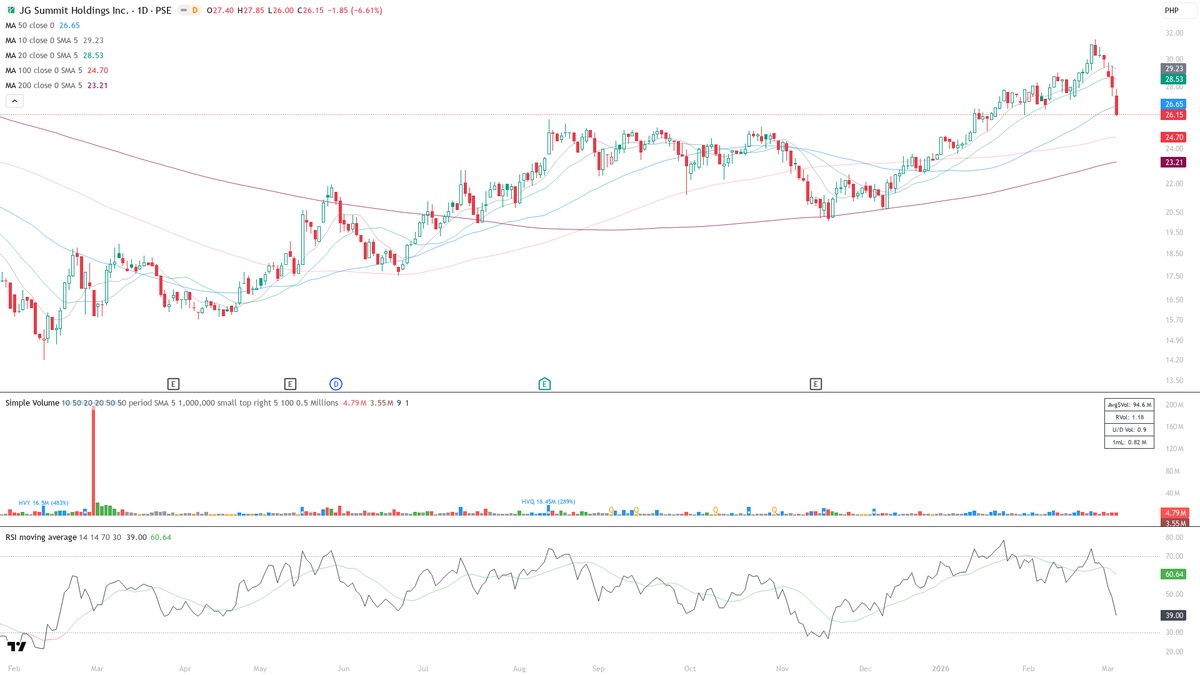
Price at ₱26.15 has fallen into a short-term downtrend, trading below its 10-day SMA of ₱29.23 and 20-day SMA of ₱28.53, while also breaking below the 50-day SMA at ₱26.65 to enter a medium-term downtrend. Bearish momentum is evident as RSI(14) is at 39.00, positioned below 50 and its RSI-MA of 60.64, with both lines clearly sloping downwards on above-average volume (RVol 1.18). Price is currently testing immediate support at ₱26.00, having closed just above this level, with the 50-day SMA at ₱26.65 now acting as critical overhead resistance. Investors should closely monitor the ₱26.00 support; a decisive breakdown below this level would invalidate any near-term consolidation efforts and open the path towards the 100-day SMA at ₱24.70.
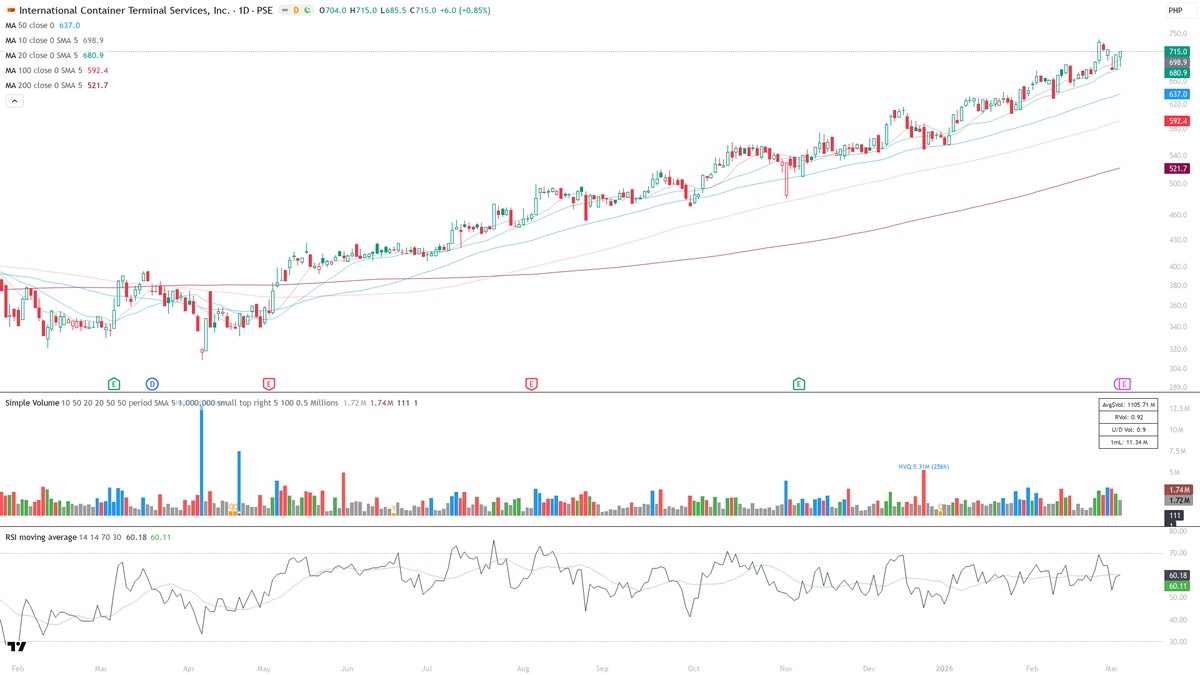
Price at ₱715.00 maintains a short-term uptrend with the 10d SMA at ₱698.9 comfortably above the 20d SMA at ₱680.9, while the medium-term trend also remains bullish with price above the 50d SMA at ₱637.0. RSI(14) reads 60.18, signaling bullish momentum as it remains above 50 and its 20-period moving average at 60.11, though both RSI lines show a largely flat slope over the recent period on below-average volume (RVol 0.92). The stock is currently compressing between immediate support at ₱708.00 and resistance at ₱738.00, having recently pulled back from highs near the resistance level. A long position could be considered on a decisive break above ₱738.00 with a potential medium-term target of ₱1,075.79, invalidated by a sustained close below the 50d SMA at ₱637.0.

Price at ₱58.35 is now in a short-term downtrend, below the 10d SMA (₱63.27) and 20d SMA (₱62.72), and in a medium-term downtrend, having broken the 50d SMA (₱60.13). RSI(14) at 40.03 is clearly falling below its RSI-MA(20) at 55.16, indicating strong bearish momentum on high selling volume with an RVol of 2.23. PNB has extended its weekly decline of -10.16%, failing resistance at ₱59.72 and now testing immediate support at ₱57.30. A break below ₱57.30 would likely signal further markdown towards the 100d SMA at ₱56.11, invalidating any immediate rebound potential.

to view complete list and market research
SBX MVQL Model Portfolio
to view complete portfolio and MVQL Framework and Watchlist
Stay Ahead of the Market
Get the SBX Daily Brief delivered to your inbox every trading day.
Subscribe Now