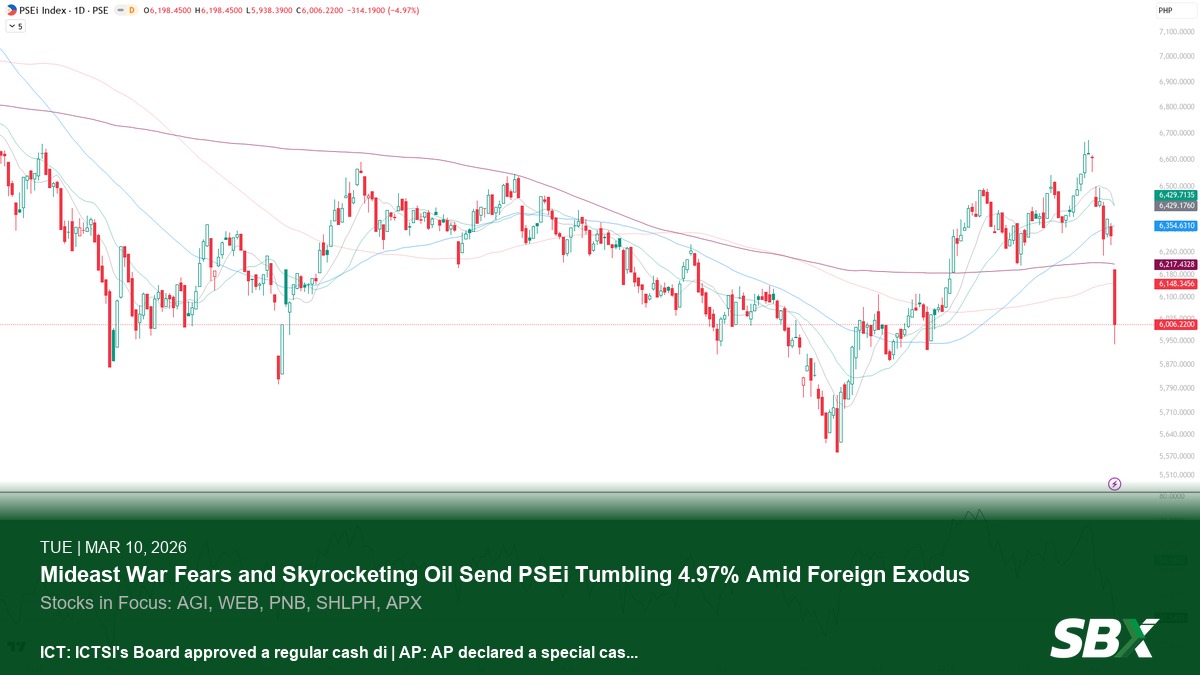
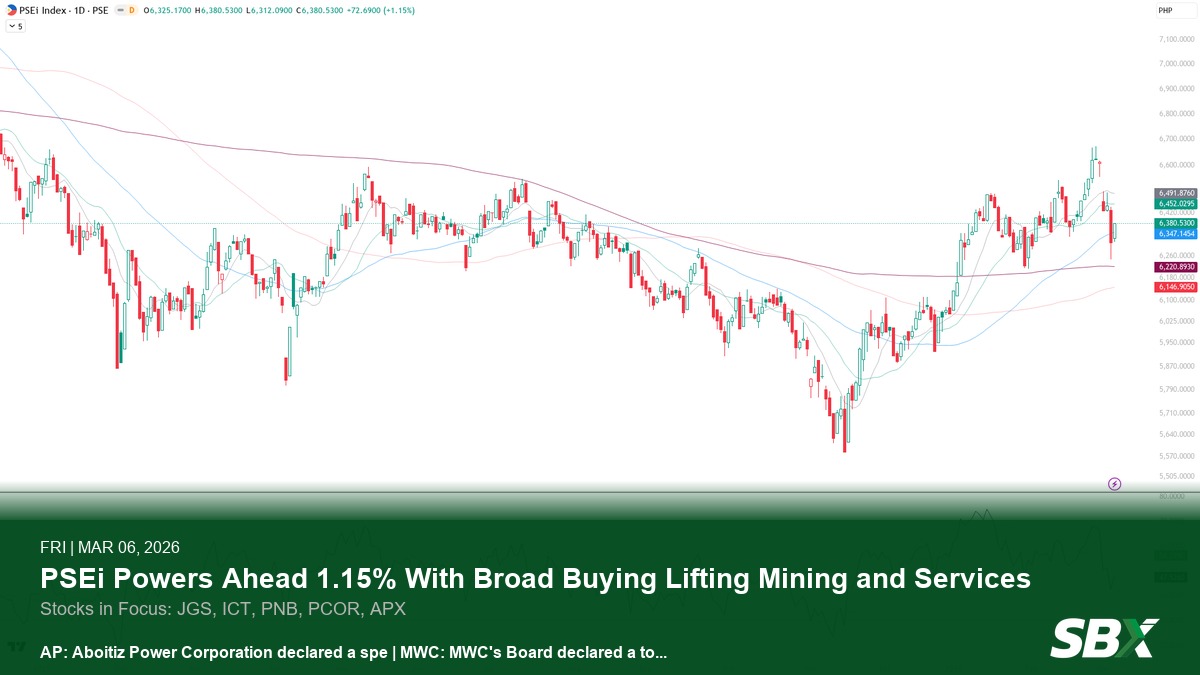
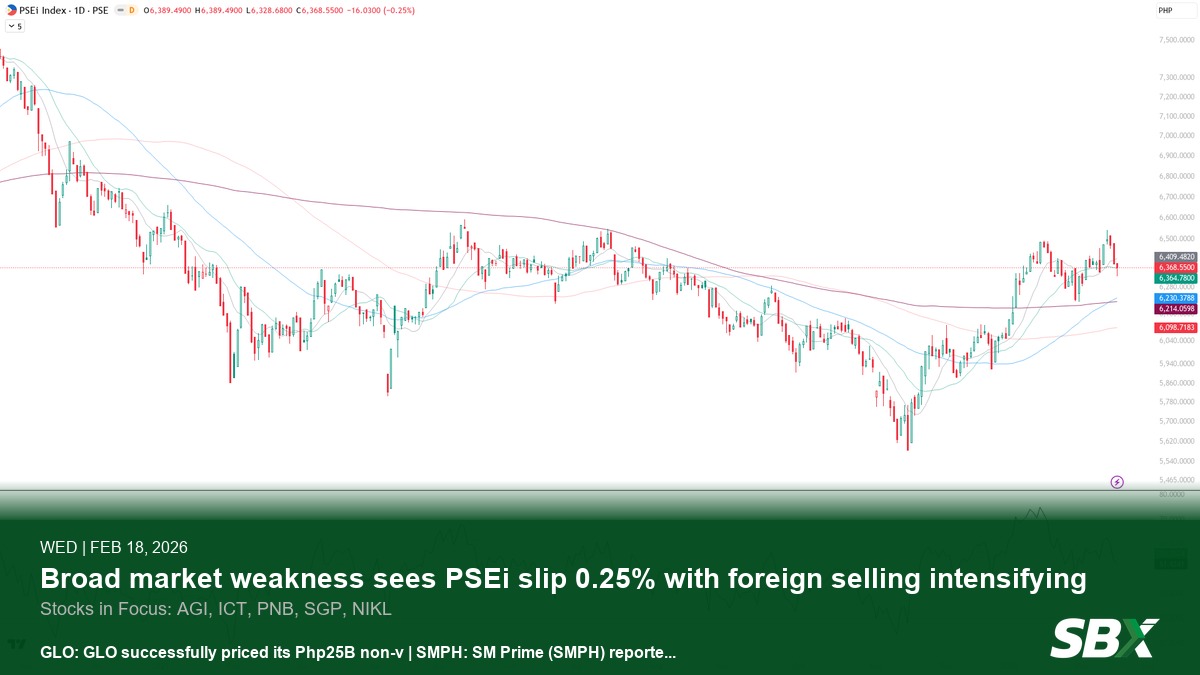
PSEi Slips 0.25% as Industrial Sector Drags; SCC, DMC Tumble on DOE news (Feb 18, 2026)
PSEi closed at 6,368.55, down 0.25%, as net foreign selling reached P156.65M. The Industrial sector led declines, with SCC and DMC plummeting.
Market Snapshot
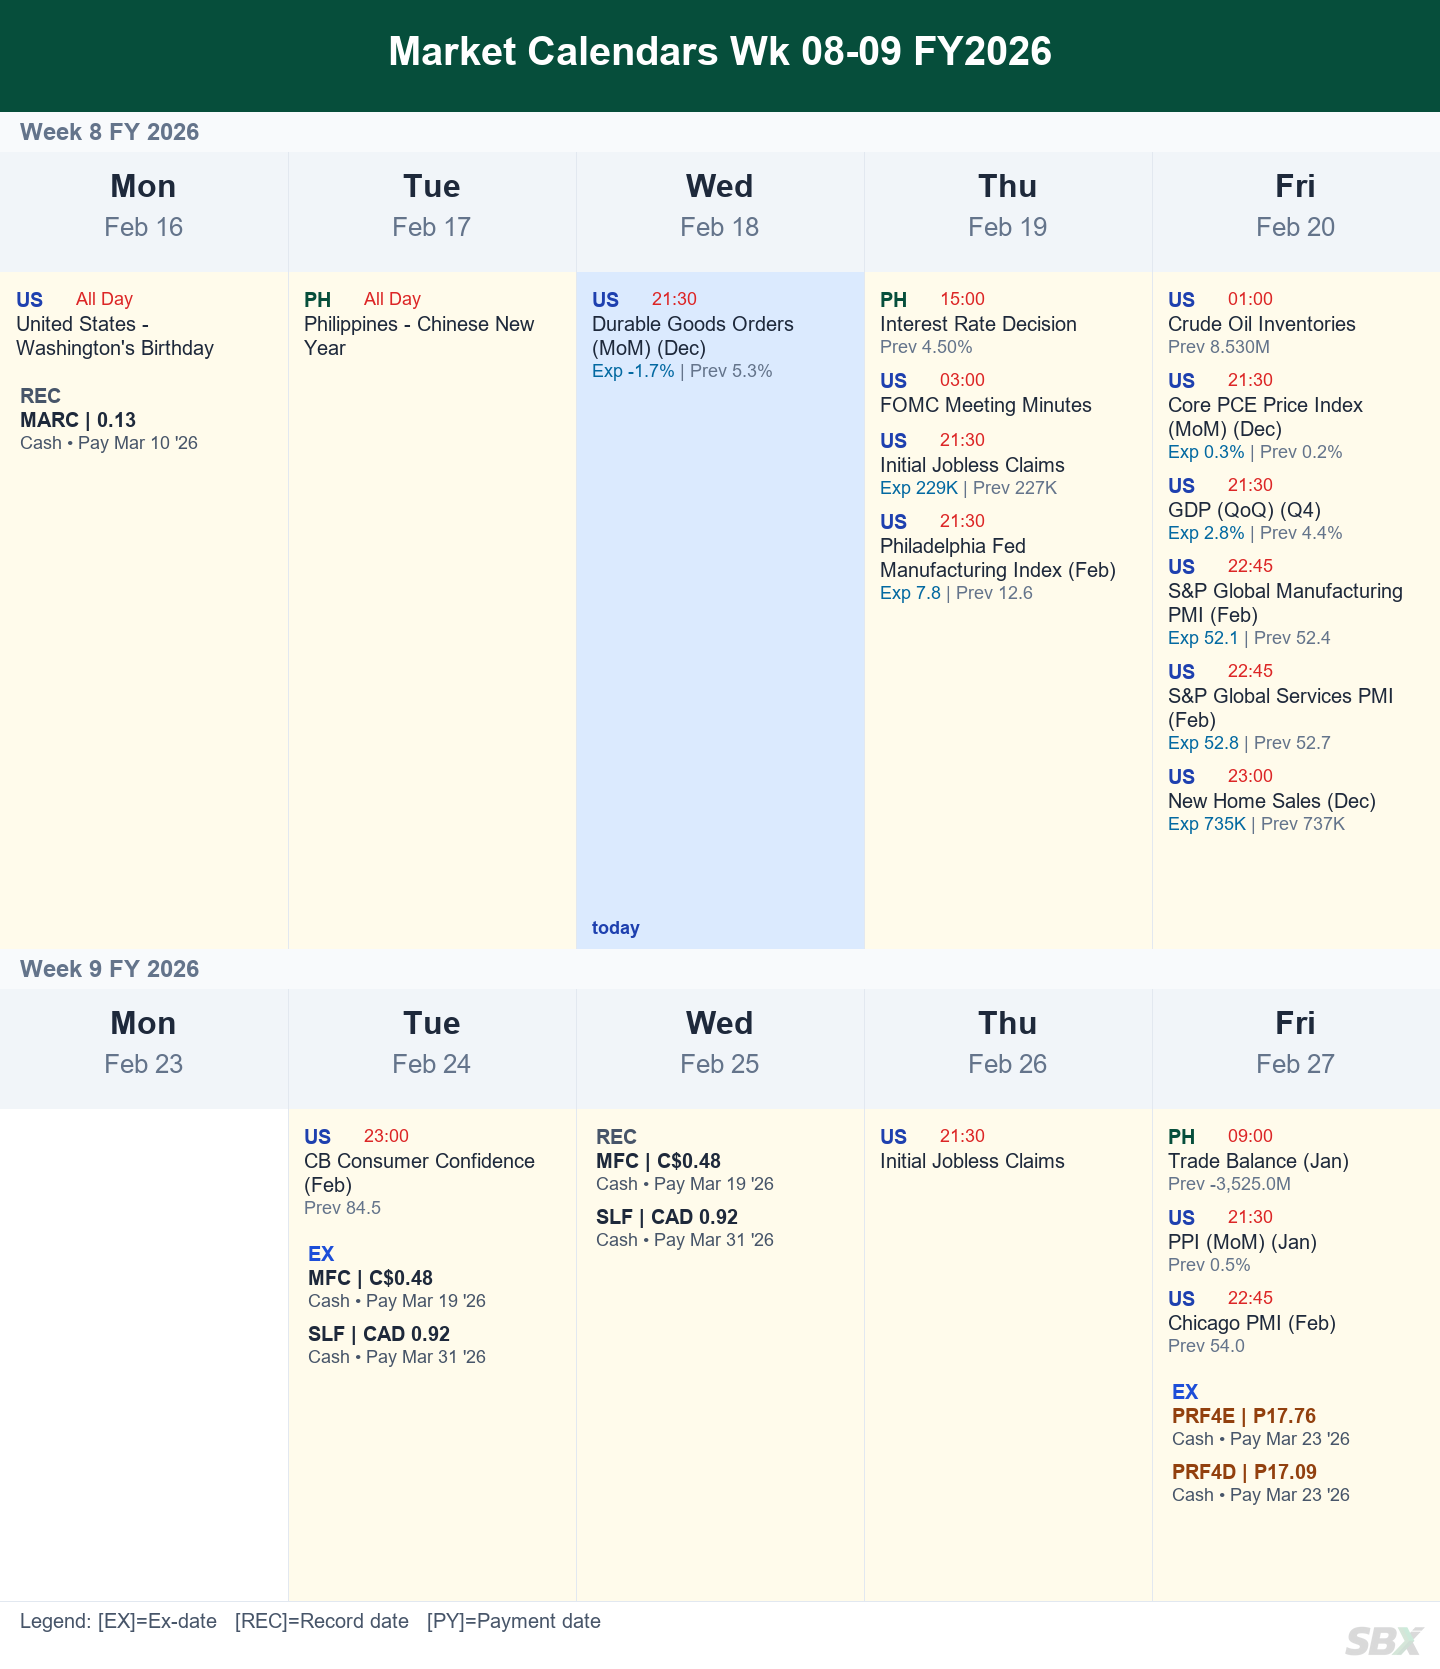
Market & Dividend Calendar
Sources: Investing.com, PSE Edge
Broad market weakness sees PSEi slip 0.25% with foreign selling intensifying.
The Philippine Stock Exchange Index (PSEi) ended Monday's session in negative territory, shedding 0.25% to close at 6,368.55. The market's decline was largely attributed to selective profit-taking and cautious investor behavior ahead of key local economic data releases. Despite the marginal drop, several blue-chip issues showed resilience, though overall trading volume remained relatively thin as the peso hovered near the 58-level against the US dollar.
Index and Sectors
PSEi 1-Year Chart
The PSEi is experiencing a short-term pullback, with price currently at the 20-day SMA at 6,368.55, having fallen below the 10-day SMA at 6,409. The medium-term trend remains an uptrend, as price holds above the 50-day SMA at 6,280, with the 20-day SMA above the 50-day SMA. RSI is at 51.92, above 50 but below its 20-day MA of 55.75, with both RSI and RSI-MA lines clearly declining over the recent bars.

PSE Heatmap
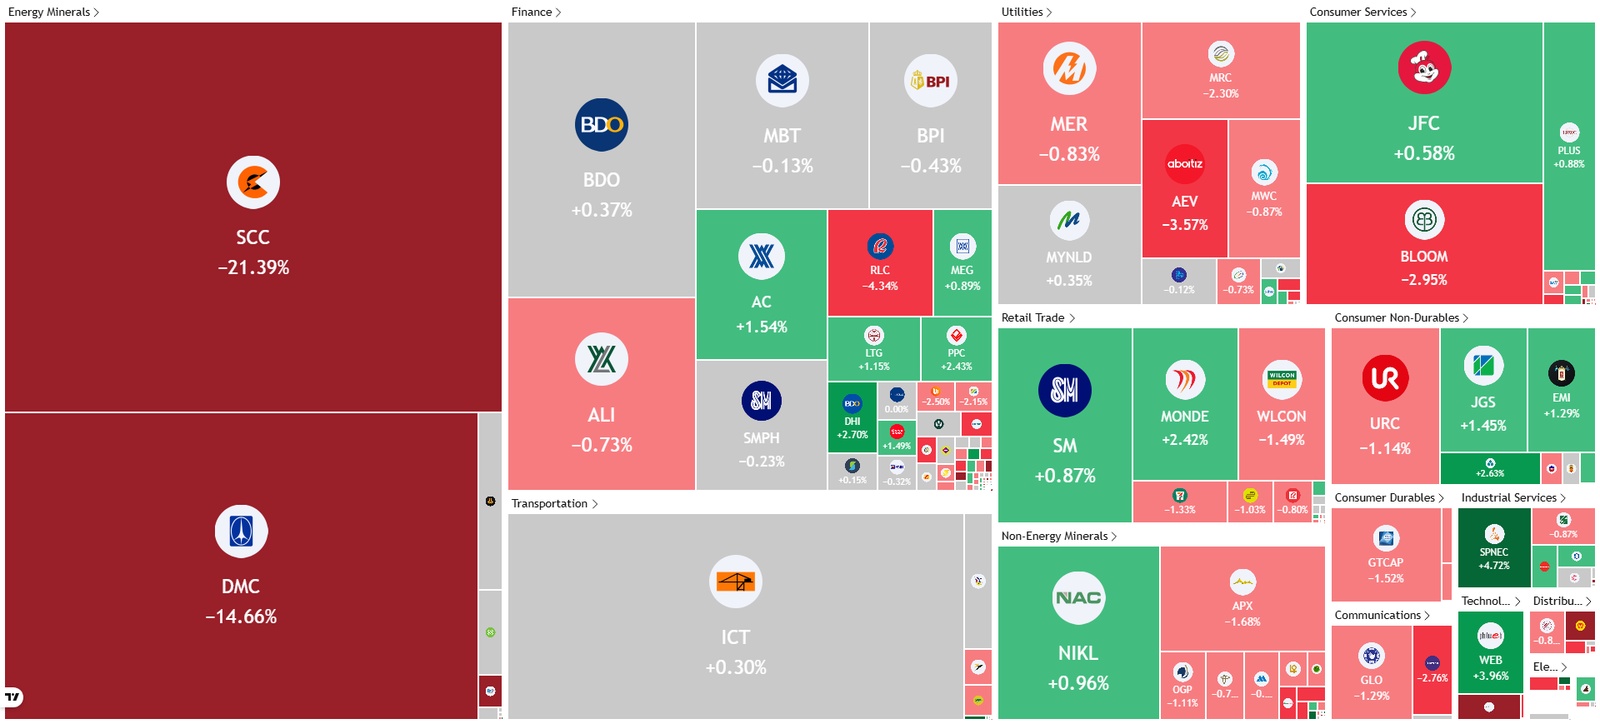
The market exhibited a predominantly negative bias with broad red coloration across the heatmap, particularly in Energy Minerals and parts of Industrials, although green pockets were observed in Consumer Services and Finance. Prominent decliners included SCC at -21.39% and DMC at -14.66%, significantly contributing to the deep red clustering observed across the entire Energy Minerals sector. In contrast, JFC posted a modest gain of +0.58%.
Daily Movers


Highly Viewed Disclosures
Global Markets & Macro
Europe Rallies as Fed Officials Signal Rates on Hold
European equities led gains with the DAX advancing 0.80% and the FTSE 100 up 0.79%, as hints from Fed officials about rates on hold and potential future cuts provided underlying market support. US indices were mixed; the S&P500 added 0.10% and Dow Jones rose 0.07%, while the Nasdaq 100 slipped 0.13%. The VIX declined 1.31% to 20.33, reflecting reduced volatility expectations. Asia saw divergence, with Nikkei down 0.42% and Hang Seng up 0.52%.
WTI Crude Slips Below $63; Industrial Metals Retreat on Demand Concerns
WTI crude slipped 1.11% to $62.19/bbl, easing potential import cost pressures for the Philippines. Natural Gas plunged 5.80% to $3.06/MMBtu, leading the broad decline. Copper retreated 2.05% to $5.67/lb, while Aluminum edged down 0.82% to $2,991.00/mt, as both industrial metals signaled softness in global demand.
Gold, Silver Retreat Sharply Amid Easing Iran Tensions, Holiday Liquidity Drain
Gold retreated significantly, dropping 2.52% to $4,895.60/oz, as easing geopolitical tensions from Iran diplomacy diminished its safe-haven appeal. Silver followed suit, registering a steeper decline of 5.82% to $73.32/oz. The broader precious metals complex faced additional headwinds from reduced trading liquidity due to the Lunar New Year holiday, amplifying the downward pressure.
Global Indices & Commodities
Stocks in Focus

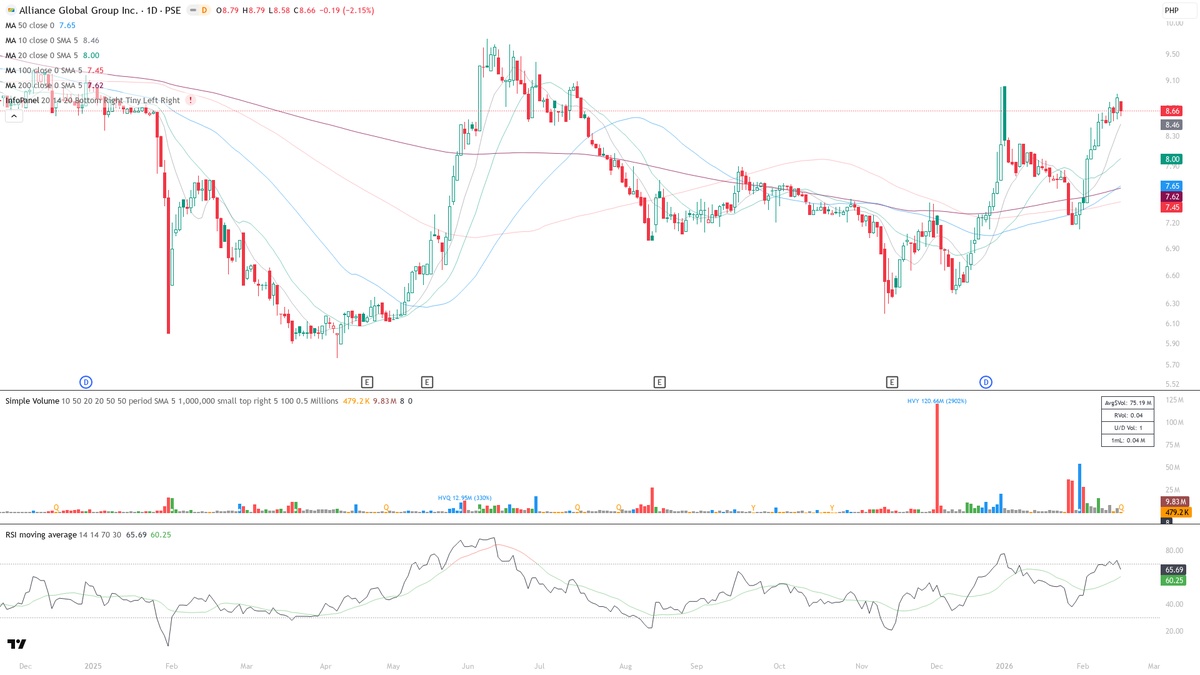
Price at ₱8.66 holds a short-term uptrend above its 10d SMA (₱8.46) and 20d SMA (₱8.00), maintaining a medium-term uptrend above 50d SMA (₱7.65). RSI(14) at 65.69 signals bullish momentum above its RSI-MA(20) at 60.25, both lines rising, despite the -2.15% pullback yesterday on RVol 0.04. A break past resistance at ₱8.67 targets the ₱9.74 medium-term objective, invalidated by a close below the 20d SMA at ₱8.00.
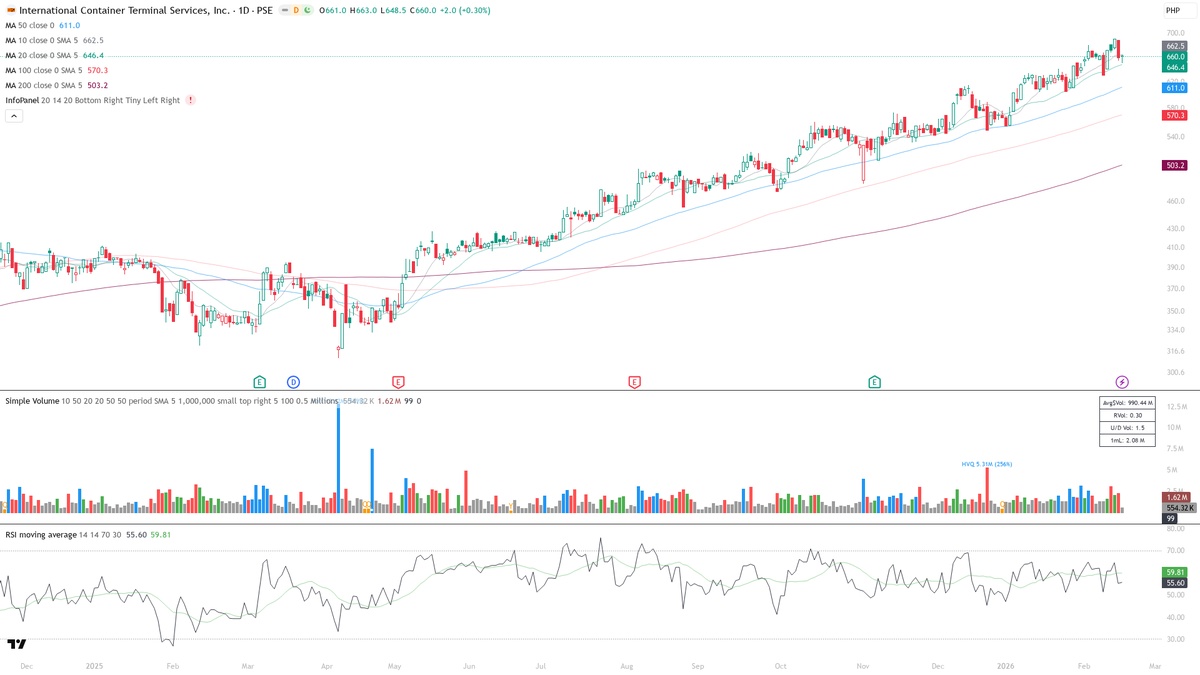
Price at ₱660.00 holds a medium-term uptrend above its 50d SMA (₱611.0); the short-term trend transitions as 10d SMA (₱662.5) is above 20d SMA (₱646.4). RSI(14) at 55.60 indicates mixed momentum, above 50 but below its declining 20-period MA (59.81), on dry volume (RVol 0.30). A break above R1 (₱662.50) could target ₱984.67, invalidating below 20d SMA (₱646.4).

Price at ₱61.80 is transitioning short-term, between 10d (₱62.05) and 20d (₱61.67); the medium-term uptrend persists with 20d above 50d (₱57.58). RSI(14) at 56.90 shows bullish momentum above its upward-sloping RSI-MA(20) at 53.31, but volume is extremely dry with RVol 0.14. A rally above R1 (₱62.05) could target ₱71.00; invalidation below S1 (₱61.67).

to view complete list and market research
SBX MVQL Model Portfolio
to view complete portfolio and MVQL Framework and Watchlist
Stay Ahead of the Market
Get the SBX Daily Brief delivered to your inbox every trading day.
Subscribe Now|
Disclaimer
Seedbox Securities Inc. prepared this report using sources believed reliable, but makes no warranty on accuracy, completeness, or timeliness and is not liable for losses from its use. Seedbox, its directors, officers, analysts, or employees may hold positions in covered securities and trade them. Views and estimates reflect the analyst's judgment at publication and may change without notice. This is not investment advice or a solicitation to trade. Past performance is not a guarantee of future results. Investors should make independent decisions and seek professional advice. No part of this report may be reproduced without Seedbox's prior written consent.
---------------
SBX Research Team
|