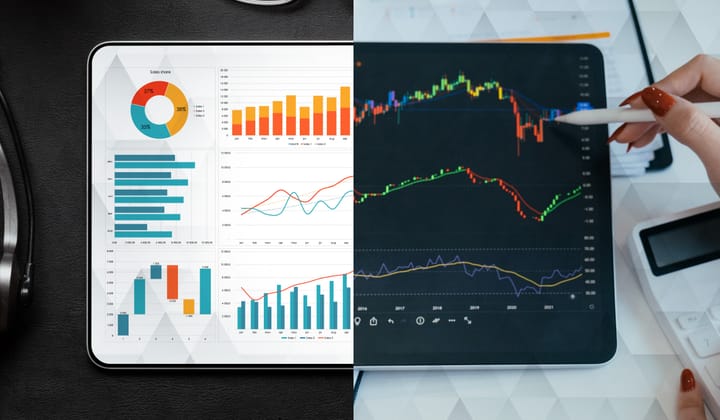
Trader's Guide to Thriving with Technical Analysis
Technical analysis is an essential tool for investors and traders aiming to evaluate and predict the future price movements of assets like stocks, currencies, and commodities.

In the ever-evolving landscape of investing, understanding market trends is crucial for success. Technical analysis gives investors a strong tool to assess and forecast price trends in assets like stocks, currencies, and commodities. By focusing on historical market data—primarily price and volume—traders can identify patterns and make informed decisions that can lead to thriving investment strategies. This article delves into the fundamentals of technical analysis, exploring its key concepts, tools, and how it can enhance your investment approach for better financial outcomes.
What is Technical Analysis?
Technical analysis is an essential tool for investors and traders aiming to evaluate and predict the future price movements of assets like stocks, currencies, and commodities. Unlike fundamental analysis, which focuses on a company’s financial health, technical analysis emphasizes past market data—primarily price and volume. By identifying patterns and trends, investors can gain insights into potential future market behavior, enabling them to thrive in their trading strategies.
Key Tools for Thriving with Technical Analysis
The backbone of technical analysis includes various tools such as charts, indicators, and statistical measures. These elements help traders make informed decisions about when to buy or sell an asset. By studying price movements and trading volumes, technical analysts can forecast market directions, paving the way for successful trading.
The Difference Between Technical and Fundamental Analysis
While both technical and fundamental analysis aim to empower investors with informed decision-making, they operate in distinct ways:
- Fundamental Analysis: This method delves into a company’s intrinsic value by scrutinizing its financial statements, management, industry standing, and economic factors. It seeks to understand why a stock holds a certain value based on its real-world performance and potential for growth.
- Technical Analysis: In contrast, technical analysis overlooks the underlying business dynamics, concentrating solely on market data such as price movements and trading volume. This approach aims to identify the optimal moments for trading based on historical performance, facilitating a more thriving investment strategy.
In essence, fundamental analysis focuses on the “what” and “why” of a company, while technical analysis centers on the “when”—enabling investors to identify the right times to act in order to thrive in the market.
Key Concepts in Technical Analysis
- Trends: The cornerstone of technical analysis. Trends can be upward (bullish), downward (bearish), or sideways (neutral). Recognizing these trends is crucial for making timely decisions on entering or exiting positions.
- Support and Resistance: These are pivotal levels where prices typically pause or reverse. Support represents a price point where buying interest emerges, preventing further declines, while resistance signifies a level where selling interest inhibits price increases. Understanding these dynamics can greatly enhance your ability to thrive in trading.
- Moving Averages: This tool smooths out price data to reveal trend directions. The Simple Moving Average (SMA) and Exponential Moving Average (EMA) are commonly employed to track average prices over specified periods, aiding in spotting trends and potential reversals.
- Volume: The total number of shares or contracts traded within a specific timeframe. Analyzing volume can provide insights into the strength of price movements. High volume during price increases signals robust interest and potential continuation, while low volume may indicate weaker, less sustainable moves.
- Indicators and Oscillators: Tools such as the Relative Strength Index (RSI), MACD (Moving Average Convergence Divergence), and Bollinger Bands assess momentum, overbought or oversold conditions, and volatility. These indicators enrich traders' understanding, offering additional context for price movements.
- Chart Patterns: Technical analysts meticulously study price charts to identify formations like Head and Shoulders, Double Tops and Bottoms, and Triangles. Recognizing these patterns can signal potential market reversals or continuations, empowering traders to forecast future price movements.
How to Thrive Using This Knowledge in Your Investing
Ready to put your technical analysis skills into action? Download the SBX app for free on Google Play and the App Store today! With SBX, you’ll have all the tools and insights you need to thrive in the stock market, making every trade a step towards your financial goals. Start now and elevate your trading strategy with ease!


